
In my last couple of posts I talked about how much of your (autosomal) genome you inherit from a particular ancestor [1,2]. In the chart below I show a family tree radiating out from one individual. Each successive layer out shows an individual’s ancestors another generation back in time, parents, grandparents, great-grandparents and so on back (red for female, blue for male).

Each generation back your number of ancestors double, until you are descended from so many people (e.g. 20 generation back you potentially have 1 million ancestor) that it is
quite likely that some people back then are your ancestors multiple times over. How quickly then does your number of genetic ancestors grow, i.e. those ancestors who contributed genetic material to you?
Each generation we go back is expected to halve the amount of autosomal genetic material an ancestor gives to you. As this material inherited in chunks, we only have to go back ~9 generations until it is quite likely that a specific ancestor contributed zero of your autosomal material to you (see previous post). This process is inherently random, as the process of recombination (the breaking of chromosomes into chunks) and transmission are both random sets of events. To give more intuition, and to demonstrate the nature of the randomness, I thought I’d setup some simulations of the inheritance genetic process back through time.
Below I show the same plot as above (going back 11 generations), but now ancestors that contribute no (autosomal) chunks of genetic material are coloured white (I give the % of ancestors with zero contribution below). I also wanted to illustrate how variable the contribution of (autosomal) genetic material was across ancestors in a particular generation. So I altered the shade of the colour of the ancestor to show what fraction of the genome they contributed. In choosing a scale I divided that fraction through by the maximum contribution of any ancestor in that generation, so that the individual who contributed the most is the darkest shade. Below the figure I give the range of % contributions to this individual, and the mean (which follows 0.5k).

It’s quite fun to trace particular branches back and see their contribution change over time. These figures were inspired by ones I found at the genetic genealogy blog. I’m not sure how they generated them, and they are for illustrative purposes only. I made scripts to do the simulations and plot in R. I’ll post these scripts to github shortly.
To give a sense of how variable this process is, here’s another example

From these it is clear that your number of ancestors is increasing but no where near as fast as your number of genealogical ancestors. To illustrate this I derived a simple approximation to the number of genetic ancestors over the generations (I give details below). Using this approximation I derived the number of genetic and genealogical ancestors, in a particular generation, going back over 20 generations:

Your number of genealogical ancestors, in generation k, is growing exponentially (I cropped the figure as otherwise it looks silly). Your number of genetic ancestors at first grows as quickly as your number of genealogical ancestors, as it is very likely that an ancestor a few generations back is also a genetic ancestor. After a few more generations your genetic number of genetic ancestors begins to slow down its rate of growth, as while the number of genealogical ancestors is growing rapidly fewer and fewer of them are genetic ancestors. Your number of genetic ancestors eventually settles down to growing linearly back over the generations, at least over the time-scale here, with your number of ancestors in generation k being roughly 2*(22+33*(k-1)).
To get at this result I did some approximate calculations. If we go back k generations, the autosomes you received from (say) your mum are expected to be broken up in to roughly (22+33*(k-1)) different chunks spread across ancestors in generation k (you have 22 autosomes, with roughly 33 recombination events per generation). If we go far enough back each ancestor is expected to contribute at most 1 block, so you have roughly 2*(22+33*(k-1)) (from your mum and dad).
To develop this a little more consider the fact that k generations back you have 2 (k-1) ancestors k generations back on (say) your mother’s side, you expect to inherit (22+33*(k-1))/2(k-1) chunks from each ancestor. We can approximate the distribution of the number of chunks you inherit from a particular ancestor by a Poisson distribution with this mean*. So the probability that you inherit zero of your autosomal genome from a particular ancestor is approximately exp(-(22+33*(k-1))/2 (k-1)). This approximation seems to work quite well, and matches my simulations:
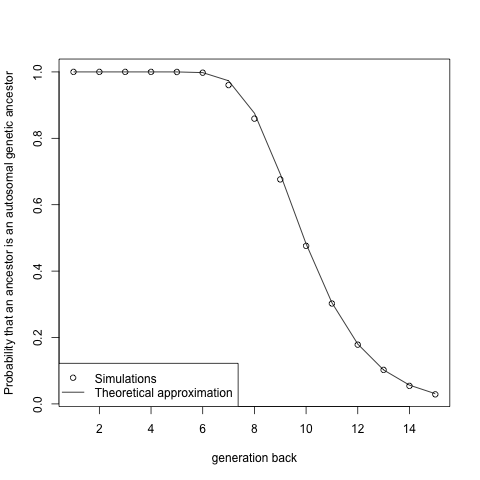
So using this we can write your expected number of genetic ancestors as 2k *(1- exp(-(22+33*(k-1))/2(k-1))), as you have 2k ancestors each contribute genetic material to you with probability one minus the probability we just derived. When we go back far enough exp(-(22+33*(k-1))/2(k-1)) ≈ 1- (22+33*(k-1))/2(k-1), so your number of ancestors, in generation k, is growing linearly as 2*(22+33*(k-1)). This is an approximation while my simulations are reasonable “exact” (in that they use real recombination data). We can get a rigorous analytical answer (albeit ignoring interference) but the calculation is fairly involved (see Donnelly 1983).
Your number of genetic ancestors will not grow linearly forever. If we go far enough back your number of genetic ancestors will get large enough, on order of the size of the population you are descended from, that it will stop growing as you will be inheriting different chunks of genetic material from the same set of individuals multiple times over. At this point your number of ancestors will begin to plateau. Indeed, once we go back far enough actually your number of genetic ancestors will begin to contract as human populations have grown rapidly over time. I’ll return to this in another post.
* this will be okay if k is sufficiently large, I can explain this in the comments if folks like. This approximation has been made by many folks, e.g. Huff et al. in estimating genetic relationships between individuals.
This post was inspired in part by an nice post by Luke Jostins (back in 2009). I think there were some errors in Luke’s code. I’ve talked this over with Luke, and he’s attached a note to the old post pointing folks here.

This is interesting but kind of self evident. I’d be interested in answering another question which you can perhaps derive from your analysis. Given that two people are, let’s say, fourth cousins, what is the distribution function of the amount of autosomal DNA they share? What is the probability that they share a certain amount (in terms of cM)? What is the probability that they share zero?
You can read about calculations of how much of the genome cousins share here. One of the reasons for doing this first round of calculations is to give people intuition so that I can do the calculations of how much relatives will share in a subsequent post.
Pingback: Ted Sallis, "Racial Purity, Ethnic Genetic Interests, and the Cobb Case" | Counter-Currents Publishing
Pingback: How many genomic blocks do you share with a cousin? | gcbias
A related question is one’s Maternal / Paternal Lineage Extinction Ratio (MLER/PLER); a parameter that may help explain speciation and what appears to be population bottlenecking. Look up ‘Inevitable Eve’.
These ideas are at the heart of coalescent theory, which describes the genealogy of individual genetic loci in the genome. The history of maternal and paternal markers (mtDNA and Y chromosome) are just two examples of this phenomenon. I’m hoping to write up more on these connections in the near future.
If you would like to print these charts with your own family data, check out:
http://progenygenealogy.com/products/family-tree-charts.aspx
(Both Ancestor and Descendant Fan charts)
I tried doing this same computation at http://burtleburtle.net/bob/future/ancestors.html , and it produced similar results. Except I’m getting about 84 additional ancestors per generation instead of 66. I had the computation measure how many ancestors contributed 1/2^^n of the total DNA as well.
Ah-hah, I was testing (i < crossovers) where crossovers was a double rather than int, so I got one more crossover per chromosome per generation. Will fix that.
Are you simulating the X as well?
Yes, I’m handling X and Y specially. X has crossovers in females, but not in males. Even in females you get one or two strongly related ancestors quite back due to X recombining only every other generation. I had a bug for awhile where one of the X from daughter was interpreted by the father as Y, but I fixed that. (The male contribution to the daughter is actually the female contribution to the father.) Currently I’m getting an additional 68 ancestors per generation.
So I’m not doing the X chromosome, but I’m planning to add it in shortly. I need to work on the visualization to handle doing it.
Pingback: Book of Mormon and DNA Studies | Meridian Magazine
Very interesting, however; the actual biological outcome would be very different in practice compaired to a Mathmatical or Computor simulation; especially considering that during Meiotic Division, only one, of the two sister Chromatids, of each homologous pair cross over and exchange DNA.,Consequently; when Cells divide during ” Meiotic Division” any one Chromatid that did not experience a Cross over event could have polarized to one side of the Cell: subsequently end up in the Germ line free of Chromosomal Breakage.
These simulations would work in principle only if all Sister Chromatids of each homologous pair crossed over, however; only one of each Sister Chromatid, of each homologous pair crosses over, consequently; many Chromosomes would be handed down without any crossover event.
Thanks for your comment. The simulations do not assume that every transmitted chromosome experiences crossing over. They use data from real meiotic transmissions and so they fully account for the fact that chromosomes can be transmitted without crossovers (and other complications of meiosis, e.g. interference). See details at bottom of this previous post: https://gcbias.org/2013/10/20/how-much-of-your-genome-do-you-inherit-from-a-particular-grandparent/
Anecdotal info here: I recently looked at my own ancestors and found things got pretty darned incestuous back in the early 1800’s or so. That’s 4 to 6 generations back. Seemed like there were large families where even fairly close cousins were having lots of kids. They lived in the US outside what passed for big cities in the day, so there could not have been many choices for mates.
That history is probably the norm, eh? Mostly farmers at the time. Living on rural farms.
Pingback: The Sullivan Project – Roots in Meenigorman
Can you give me an approximate number to multiply by the number of times an individual ancestor appears in generations 13-15?
Interesting. As a geologist Iam fascinated by the technique of using DNA analysis fo mapping human ancestry and have written my own blog, http://www.norgesdna.com, whoch attempts to put the science in layman’s language. There I discuss the concept of mitochondrial Eve and Y-chromosomal Adam, the most recent common ancestors of all human beings living today. I know that these concepts were controversial when I wrote my blogand probably still are, but has anyone out there simulated this in an attempt to determine when an d where these two lived?
Pingback: How many ancestors do we have? | Our Scottish Clan
Pingback: gcbias
The following paper https://www.researchgate.net/publication/323757098_How_many_ancestors_does_a_Briton_have
shows how to estimate ancestors, generation by generation, cousins of any degree and the “coefficient of inbreeding” using original methods. Please take a look and leave your comments/questions there or here.
Pingback: Anzahl genetische Vorfahren pro Vorfahrengeneration – geteilte DNA der Ahnenreihen – PopGen.at
This is a fascinating analysis. Thank you.
Pingback: Human Phylogeography: The lessons learned, 1 « Why Evolution Is True
I have little to contribute, other than to say the diagrams you show here are very informative and very beautiful. They can be viewed as art generated from mathematics (I would hang them on my wall in the same way the Krebs Cycle is often displayed).
So, it’s quite possible to have inherited little to no DNA from a pair of 5th Great Grandparents? I have a couple of instances of this…
I mercilessly stole one of your charts and edited it for a post on Facebook and possibly elsewhere. I will be sure to credit this blog, however, please let me know if you’re ok with that. Otherwise I will be sure to remove it. Thanks for your excellent article. Very informative even for those of us who are not statisticians.
Pingback: Comparisons of Autosomal Genetic Models | DNA Science
Pingback: New and Improved Autosomal Genetic Model | DNA Science
Pingback: 11 Photos That Show the Resemblance Among Those in The Royal Family - Live24x7.news