Slides of Coop Lab talks/posters at SMBE

Slides from the Coop lab talks are posted below. Note that much of this work is ongoing, so please treat it as provisional. Contact us if you’d like to know more, or if you want to build on it.

Alisa Sedghifar. The Spatial Mixing of Genomes in Secondary Contact Zones

Kristin Lee. Distinguishing modes of convergent adaptation in genomic data

Chenling Xu. A novel fine-scale human recombination map reveals sex differences

Gideon Bradburd. Inferring population structure across space and time

Simon Aeschbacher. Robust inference of selection against maladaptive gene flow

Ivan Juric Quantifying selection against Neanderthal introgression

Jeremy Berg. Patterns of Genetic and Haplotypic Variation surrounding a Sweep from Standing Variation. We’ll post this shortly.
IMG_8909

Posted in Uncategorized | Leave a comment

illustrations of lab SMBE talks by Alex Cagan

One of the best features of conference coverage of SMBE has been Alex Cagan’s illustrations of talks. A few folks in the lab were luckily enough to be in the sessions that Alex was drawing in; his illustrations of their talks are below. Thanks to Alex for these wonderful pictures!

Kristin_SMBE15_Alex_Caganlink to original.

Gideon_SMBE15_Alex_Cagan
link to original.

Simon_SMBE15_Alex_Cagan
link to original.

Posted in cooplab, meetings, photos | Leave a comment

Does grasshopper sperm evolve to make female meiosis fair?

Juan Pedro M. Camacho alerted Yaniv and myself towards Herrera et al. 1996 –a potential example of male control of female meiotic drive being exposed in crosses among grasshopper populations– as we predicted in our paper (Brandvain and Coop, “Sperm should evolve to make female meiosis fair” ). It’s a shame that we missed citing this in our paper, but it’s great to see an example of one of our predictions potentially being correct. We’ve posted the comment pasted below at pubmed commons.

After our paper appeared we were made aware of a great potential example of paternal control of female meiotic transmission (Herrera et al. 1996). In many species dispensable supernumerary B-chromosomes are preferentially transmitted to offspring, with this preferential segregation (drive) often occurring through female meiosis (Jones 1991, Burt and Trivers 2006). Herrera et al. studied a widespread B chromosome polymorphism in the grasshopper, Eyprepocnemis plorans. In crosses between 1B females and males from the same focal population in which B-chromosomes were present, B-chromosomes were transmitted following Mendelian ratios. However, when the same females were crossed to males from a population where the B chromosome was not present, they transmitted their B-chromosome to much more than half of their progeny. There was no obvious reduction in fertility, suggesting that this was not due to lethality and potentially due to meiotic drive. Herrera et al suggested that the male control of female meiosis is exerted during the first meiotic division, perhaps due to an effect of substances in the male ejaculate. These results are consistent with our hypothesis that sperm-based suppressors of drive may arise and spread in response to the spread of female meiotic drive elements (such as B-chromosomes), such that female meiotic drive can re-emerge when eggs are exposed to specific sperm from a population where drive suppression had not evolved. We thank Juan Pedro M. Camacho (Universidad de Granada) for kindly bringing this example to our attention and for feedback on this note.

Yaniv Brandvain and Graham Coop

Cited References:

Jones, R.N. 1991. B-Chromosome Drive. American Naturalist 137: 430-442.

Burt, A. and R. Trivers, 2006. Genes in conflict. Belknap Press, Cambridge.

Herrera, J. A., M. D. López-León, J. Cabrero, M. W. Shaw and J. P. M. Camacho. 1996. Evidence for B chromosome drive suppression in the grasshopper Eyprepocnemis plorans. Heredity 76: 633–639.

Posted in Uncategorized | Leave a comment

Coopons at SMBE

The Coop lab are looking forward to SMBE in Vienna next week. We’ve listed our talks below.

Jeremy Berg. Patterns of Genetic and Haplotypic Variation surrounding a Sweep from Standing Variation
130B Poster session A Mon 13-Thurs16

Alisa Sedghifar. The Spatial Mixing of Genomes in Secondary Contact Zones
34B Poster session B Mon 13-Thurs16

Kristin Lee. Distinguishing modes of convergent adaptation in genomic data
10AM Population Genomics of Rapid Adaptation. Tues July 14 Festsaal

Chenling Xu. A novel fine-scale human recombination map reveals sex differences
12:15 PM Genomics of sex bias. Wed, July 15 Forum

Gideon Bradburd. Inferring population structure across space and time
10 AM Fitch Symposium Wed, July 15 Festsaal

Simon Aeschbacher. Robust inference of selection against maladaptive gene flow
16:45 PM demography vs. selection debate Wed July 15 Forum

Ivan Juric Quantifying selection against Neanderthal introgression
9:30 AM Ancient Genomes Thr July 16 Prinz Eugen

Keep an eye out for our new Coop lab t-shirts

IMG_8909

Posted in Uncategorized | Leave a comment

Gideon’s exit seminar & FroYo in Space

A few pictures from Gideon’s exit seminar celebrations.

Gid_special_slice_pizza
Chenling, Helena, Marge, Gideon, Jeremy, Kristin, Graham, Vince, Alisa, Ivan, & Simon.
Gid_special_slice_pizza_2
Gid’s exit seminar was great. A bunch of Gid’s friends and family contributed good luck messages including Luke, Peter, & Yaniv:
CPB_postdocs
The second year CPB students made a “FroYo in space” ice cream bar, with homemade frozen yoghurt & toppings, to accompany Gid’s seminar
FoYo_in_space
Gid_froyo_2
We’re not sure if Gid was more excited by his exit seminar or the frozen yoghurt to be honest:
Gid_FroYo

Posted in cooplab, photos | Leave a comment

Coop Lab BBQ/BBCoop

Gid and Marge kindly hosted a BBQ at their place for the Coop Lab.
Coop_lab_gid_BBCoop_large
Front row: Kristin, Chenling, Alisa, Graham.
Back row: Gideon, Ivan, Jeremy, Vince, Simon.

image2

Much violence was done to wooden blocks. Vince taught us how to play Kubb:
CEqLcQ6UMAAxa_v

And we played Jenga, note the strict safety-first policy of the Coop lab 😉

Posted in cooplab, photos | Leave a comment

Coop Lab BBQ (BBCoop?)

Random BBQ/taco night to celebrate the end of the quarter. We forgot to take any pictures until after we moved inside, so we are missing some folks. A great time, and much grilled meat and veggies, were had by all!

B_d-donVAAAOeKk
[Kristin, Vince, Gideon, Graham and Alisa enjoying some fine port (note the fancy port sippers modeled by all but Graham)]

photo-31

photo-30
[Ivan, Vince, Marge, Kristin, & Alisa (Simon in background)]

photo(21)
[Simon, Kristin, Vince, & Helene]

Posted in cooplab, photos | Leave a comment

Figures of Incomplete Lineage Sorting

I find figures really useful for explaining concepts like drift, differentiation, and incomplete lineage sorting. However, I often find textbook figures are not super helpful (although the Tree thinking book by Smith and Baum is good for this). So for my undergrad teaching this quarter I set myself the task of generating R code and figures. In the last post I described simple simulations of drift in single populations. In these figures each generation is a vertical column, with each diploid individual having two alleles. In each offspring generation, two random parents are chosen from each offspring, and one of each parents alleles are chosen at random.

My R code to produce these figures, and ones like them is on github here. Feel free to reuse/repurpose the figures and code. If you find them useful leave a comment, or suggest ways they could be improved. I’ll integrate these ILS figures into my popgen notes in the next month or two [pdf here].

In the figures below there are no new mutations during the simulation, so we can just track alleles over the generations.

Figure of drift causing differentiation of an ancestral polymorphism between two separated populations:

drift_split

More simulations here.

Below are three figures of complete and incomplete lineage sorting as a result of random drift of ancestral polymorphism in ancestral populations (e.g. Human-Chimp-Gorilla). All of the initial alleles are given distinct colours so their path can be tracked over time.

A different allele/lineage has fixed in all three species (e.g. human, chimp, & gorilla lineages haven’t traced back to a common ancestor yet)
completed_lineage_sorting

An allele has fixed in the two sister species (e.g. human and chimp) to the exclusion of the third (Gorilla).
completed_lineage_sorting_2

An ancestral allele has differentially fixed/lost in the two sister species (e.g. human and chimp) making one of them more related to the outgroup (e.g. humans and gorillas sharing an allele) than its sister species (chimp) at this locus.
incomplete_lineage_sorting

I’ve simulated many more figures of ancestral lineage sorting here.

Posted in popgen teaching, teaching | Leave a comment

Figures of Genetic Drift

Figures are really useful for explaining concepts like drift, however, I often find textbook figures are not super helpful. Pictures of hands reaching into jam jars of beans etc are useful metaphors but don’t really depict the process of transmission (also drift is sampling with replacement, so I’m never sure what process is really being depicted by a handful of beans). In addition it helps to be able to show multiple realizations of drift to show the randomness of drift, so multiple simulations help. Dor my undergrad teaching this quarter I set myself the task of generating R code and figures to better depict drift in diploid populations. In these figures each generation is a vertical column, with each diploid individual having a two of alleles. All of the alleles are neutral with respect to each other. In each offspring generation, two random parents are chosen for each offspring, and one of each parents alleles are chosen at random.

My R code to produce these figures, and ones like them is on github here. Feel free to reuse/repurpose the figures and code. If you find them useful leave a comment, or suggest ways they could be improved. I’ve already started to integrate figures like them into my popgen notes [pdf here].

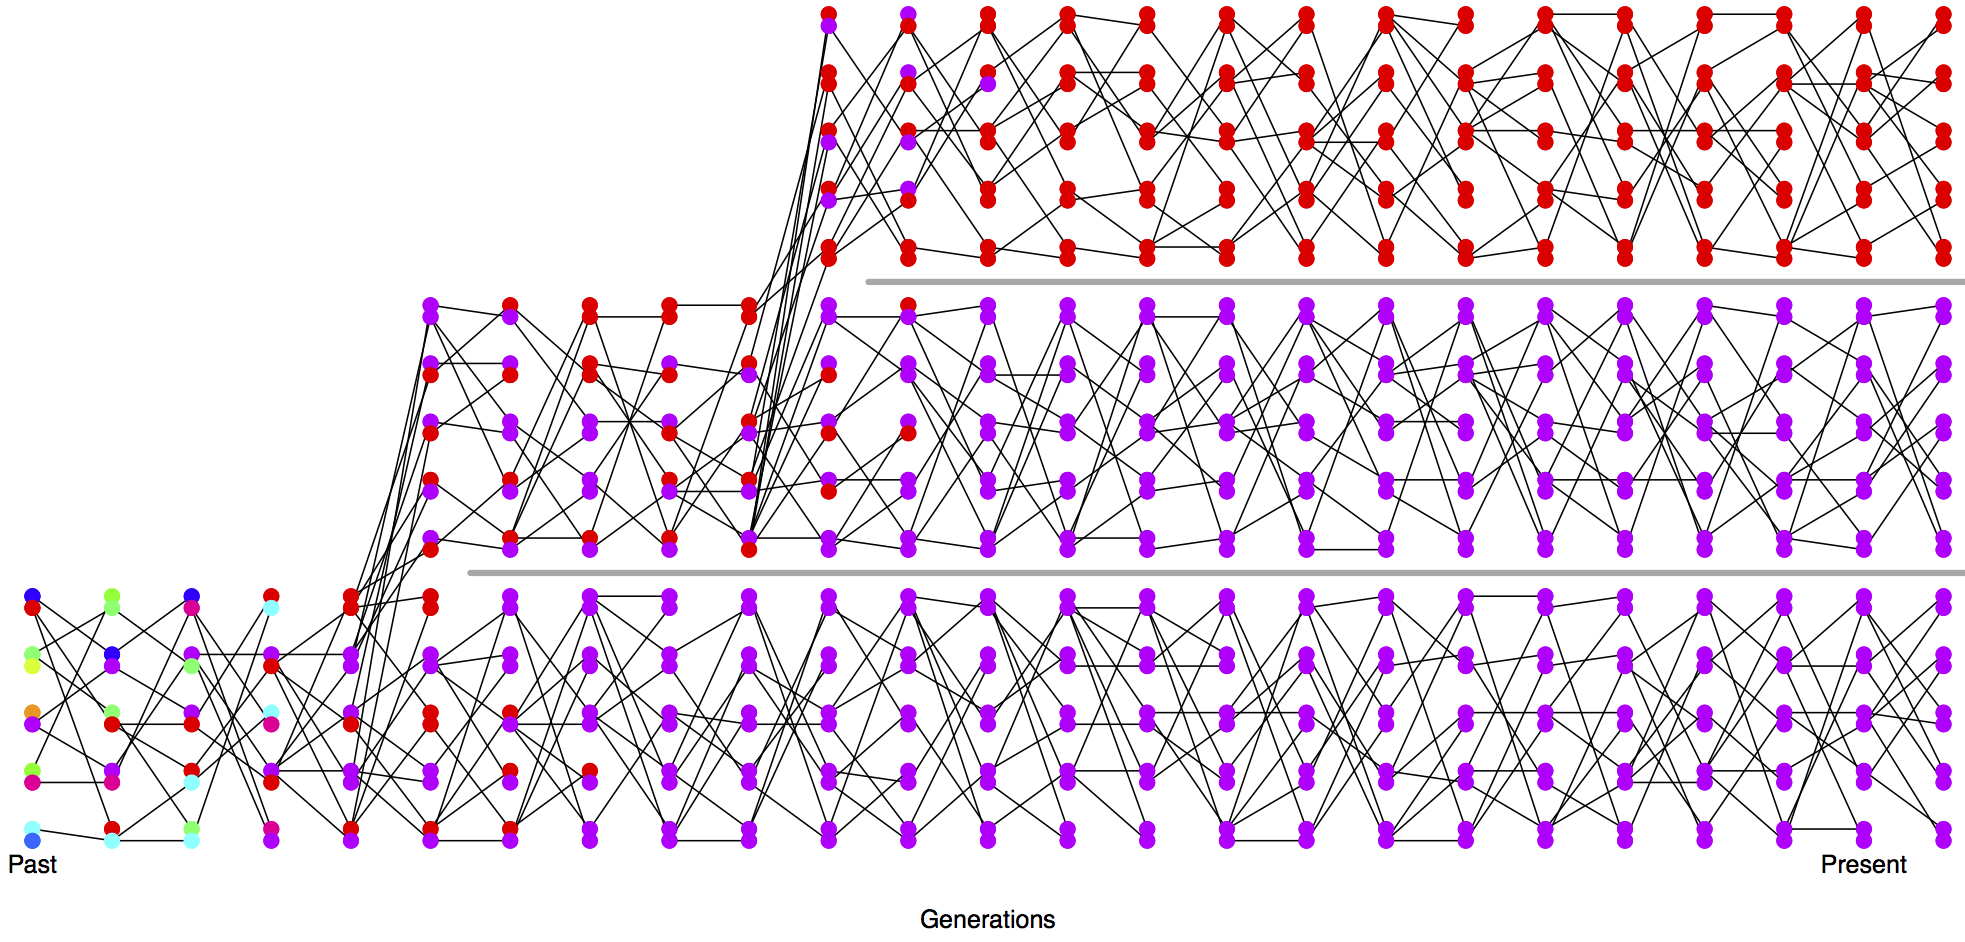
In the first set of simulations I show the loss of heterozygosity over time, in the absence of new mutations
Loss_of_het_2_alleles
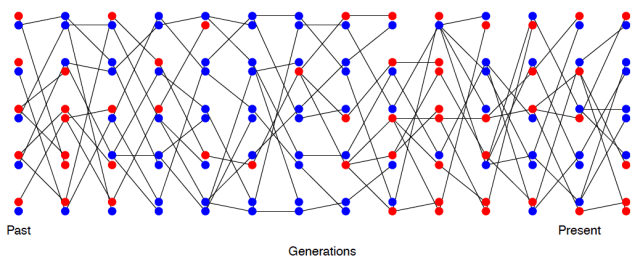
(in the figures below I use grey lines to show descent, but they don’t show up well on projectors in class, so I’ve included a link to a bunch more with black lines in a pdf below).

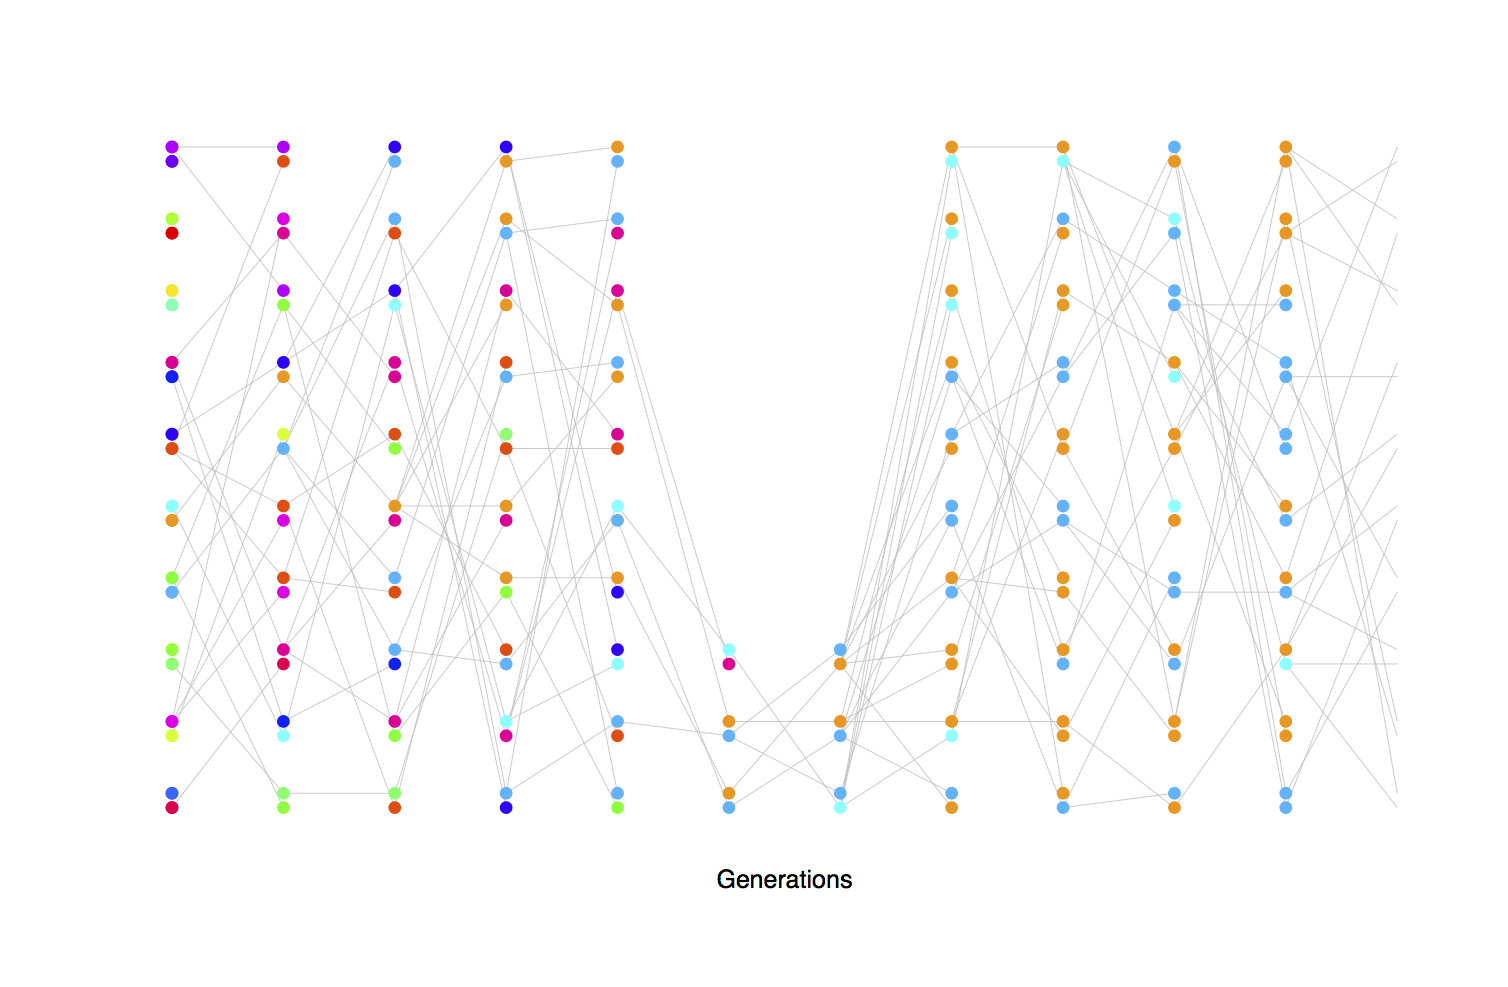
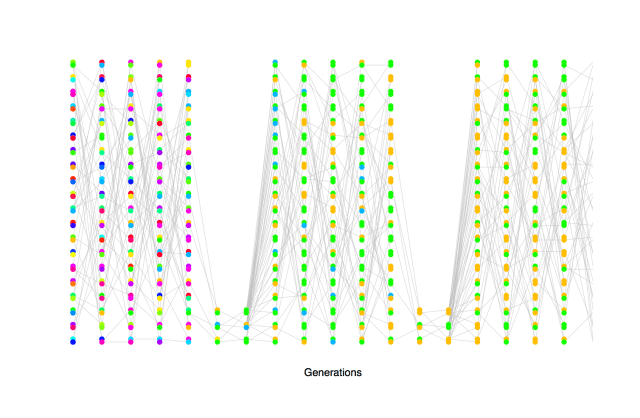
Tracking different alleles with colours
Loss_of_het_2

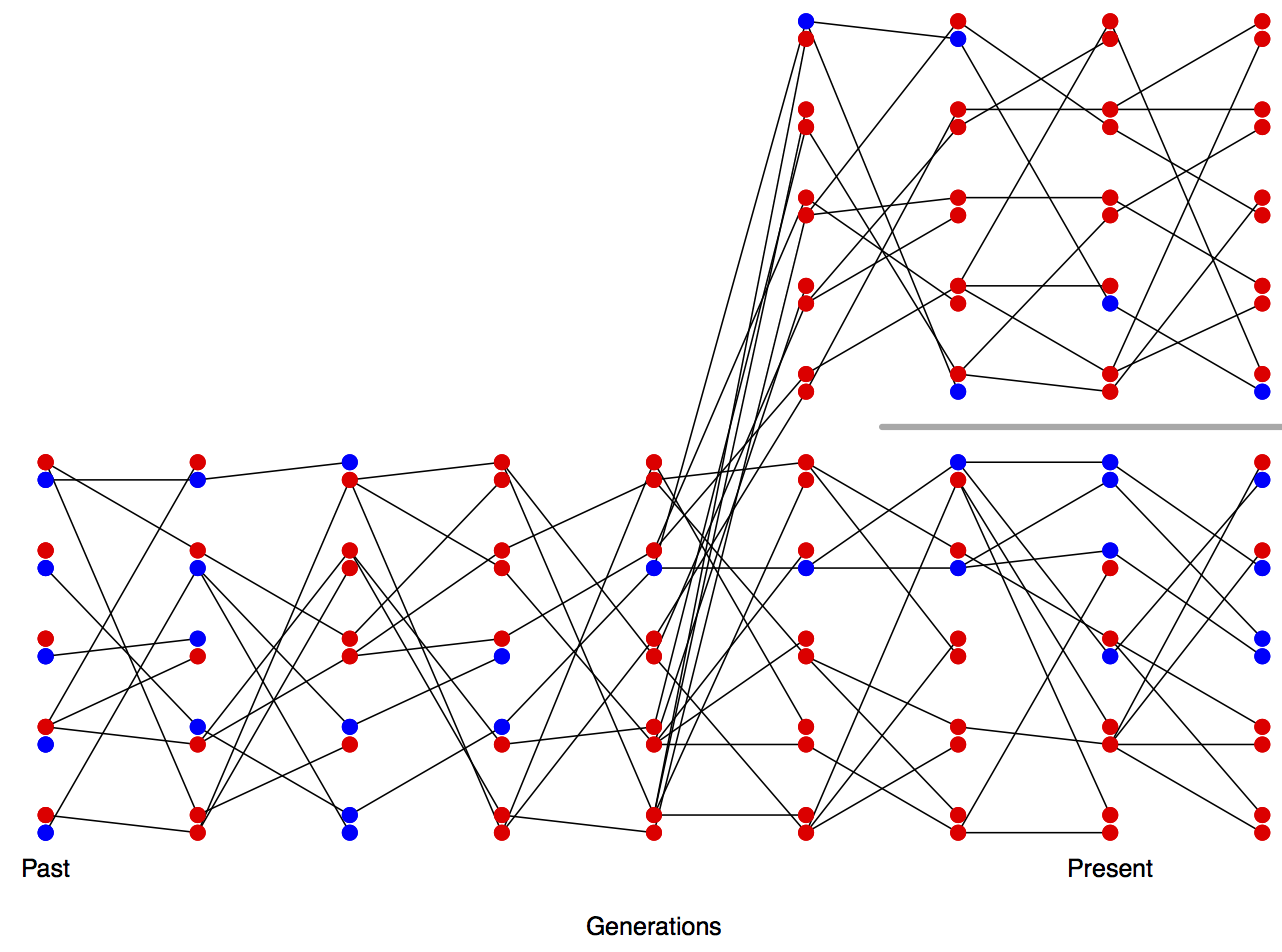
Genetic drift during bottlenecks leads to the rapid loss of genetic diveristy, particularly rare alleles, but can also by chance increase the frequency of rare alleles.
Loss_of_het_col_alleles_varying_pop

Repeated bottlenecks (fluctuating population size) speed the rate of genetic drift, and even large populations can have a fast rate of drift (i.e. a smaller effective population size) if they sometimes under go bottlenecks
Loss_of_het_col_alleles_varying_pop_2

Depiction of the fact that high variance on reproductive success increases the rate of genetic drift (decrease the effective population size). The circled individuals are randomly chosen individuals who have much higher reproductive success than other individuals (contribution to 25% of offspring each). Note the large number of descendent lines originating from there:
Loss_of_het_col_alleles_varying_RS

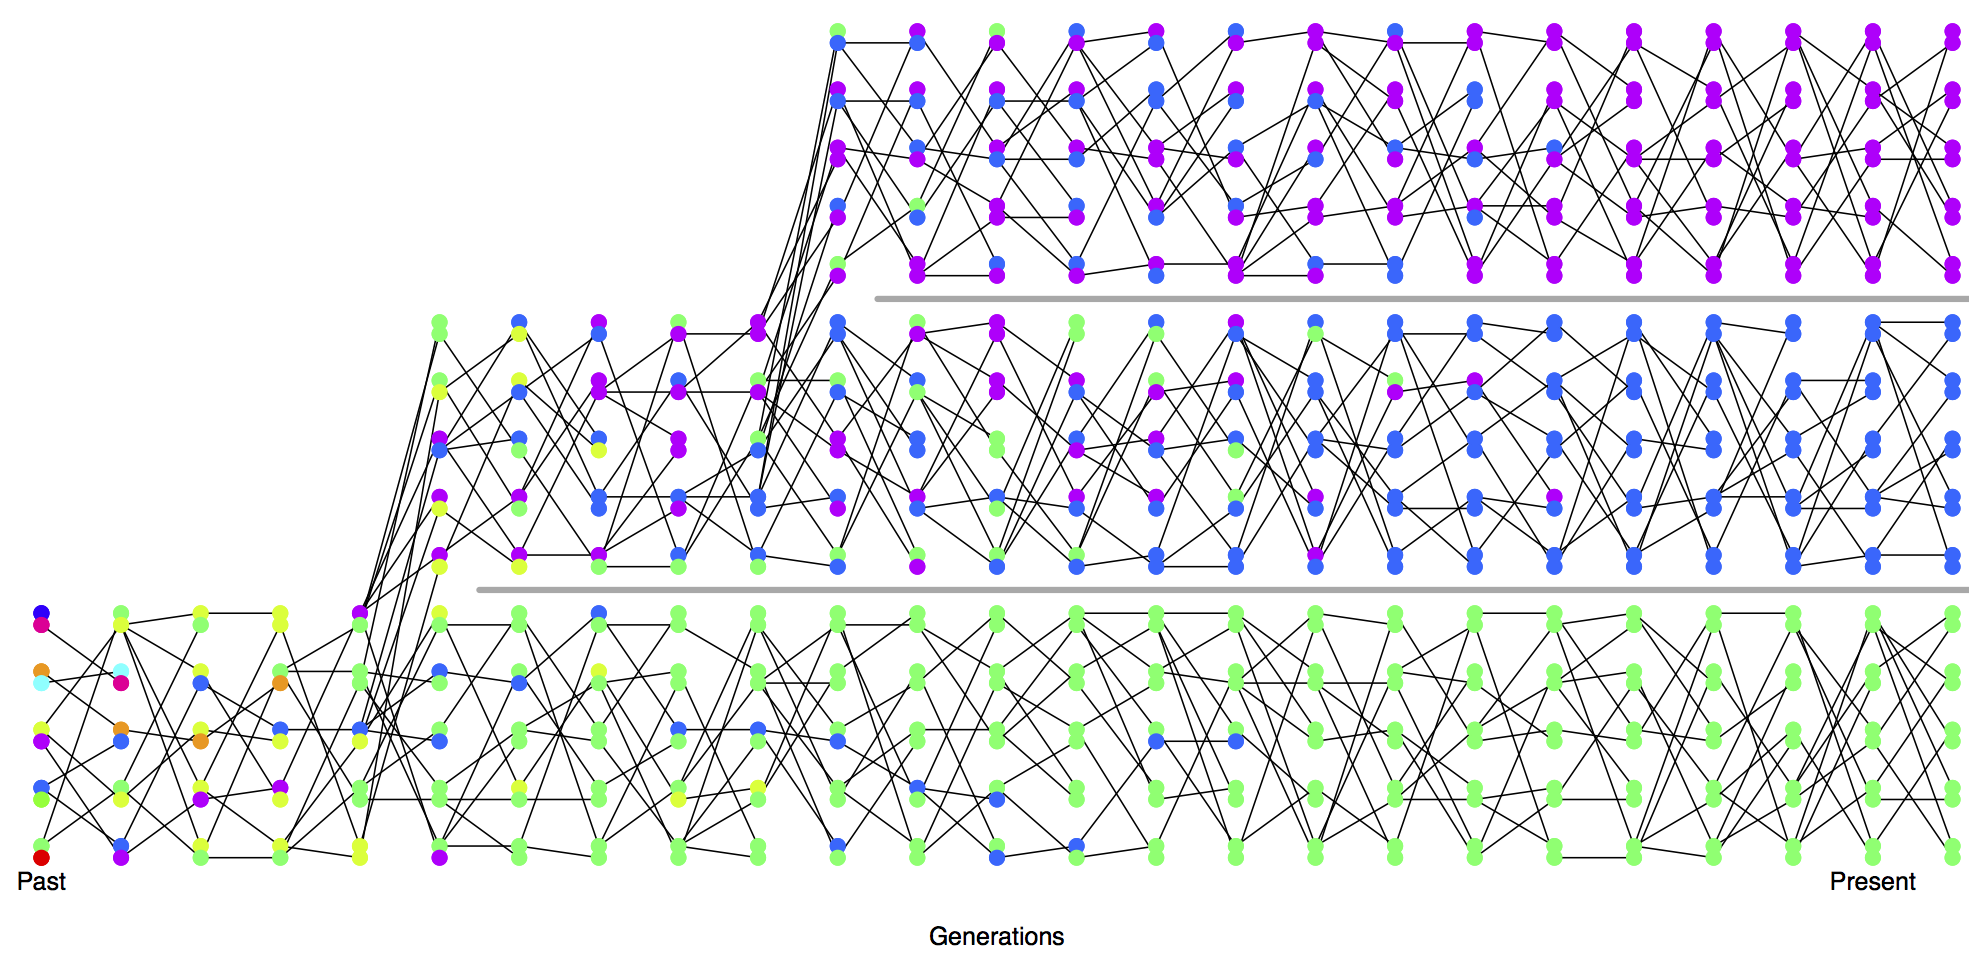
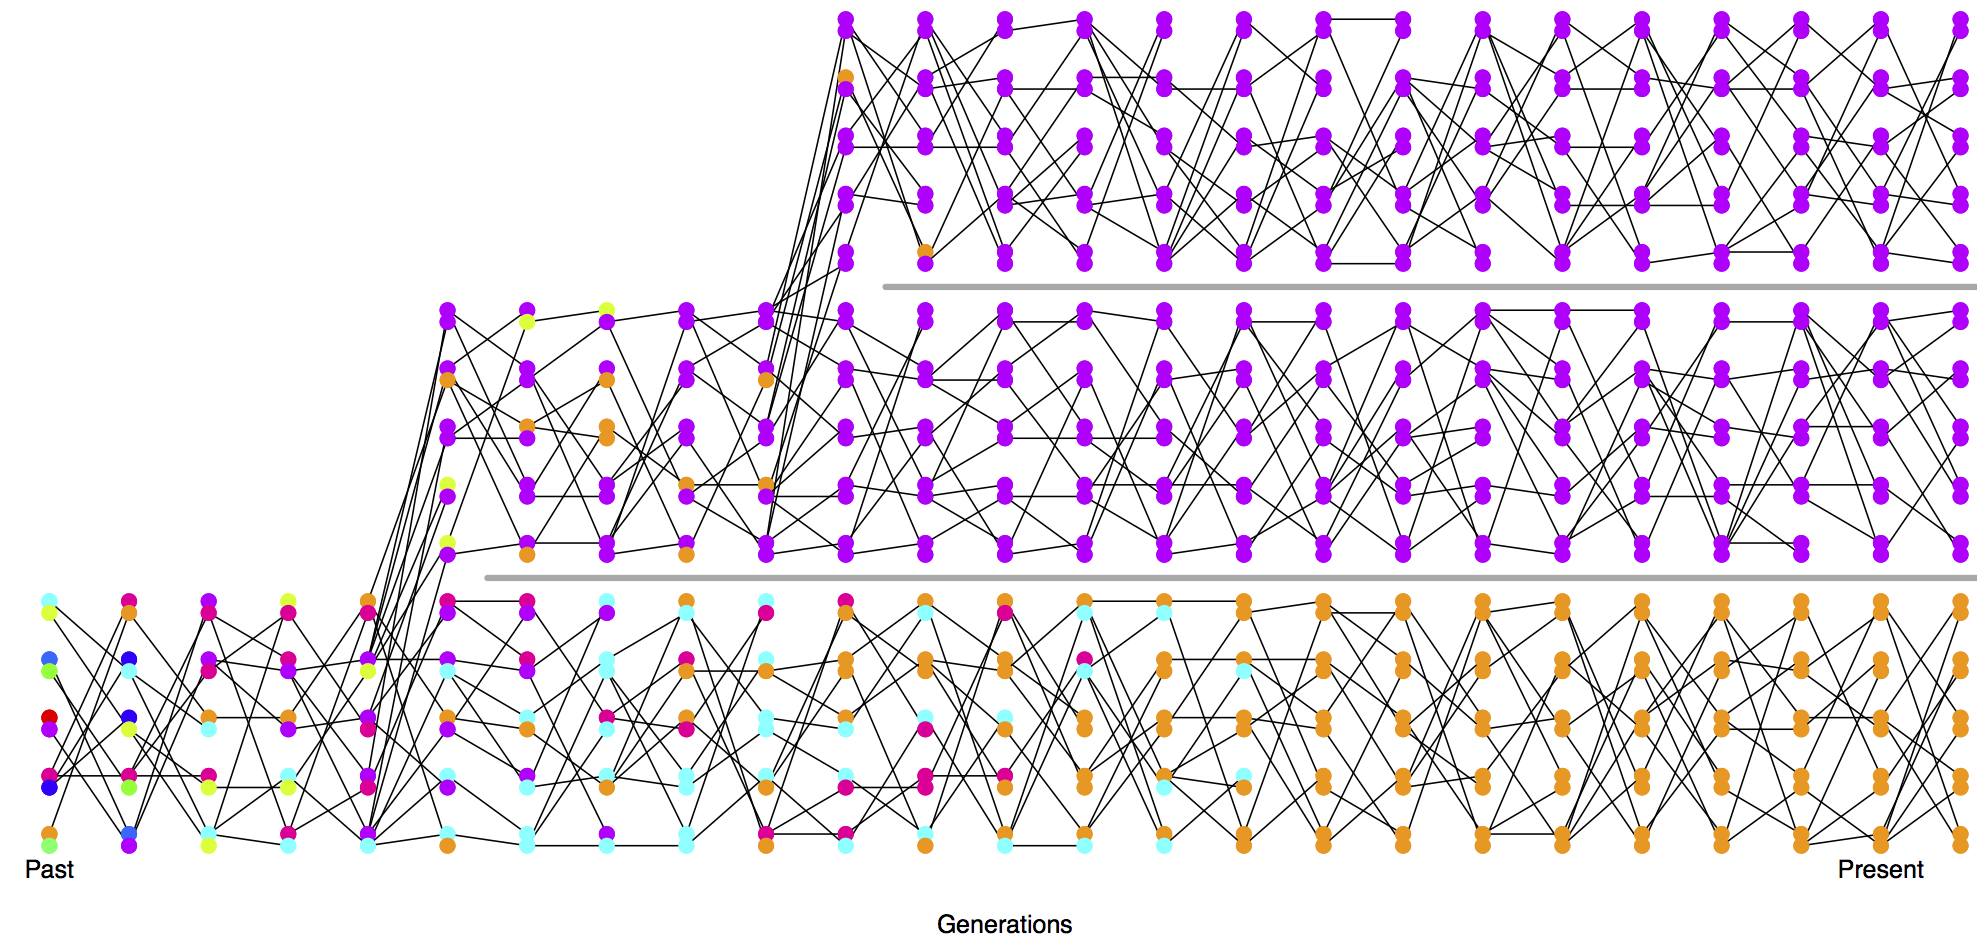
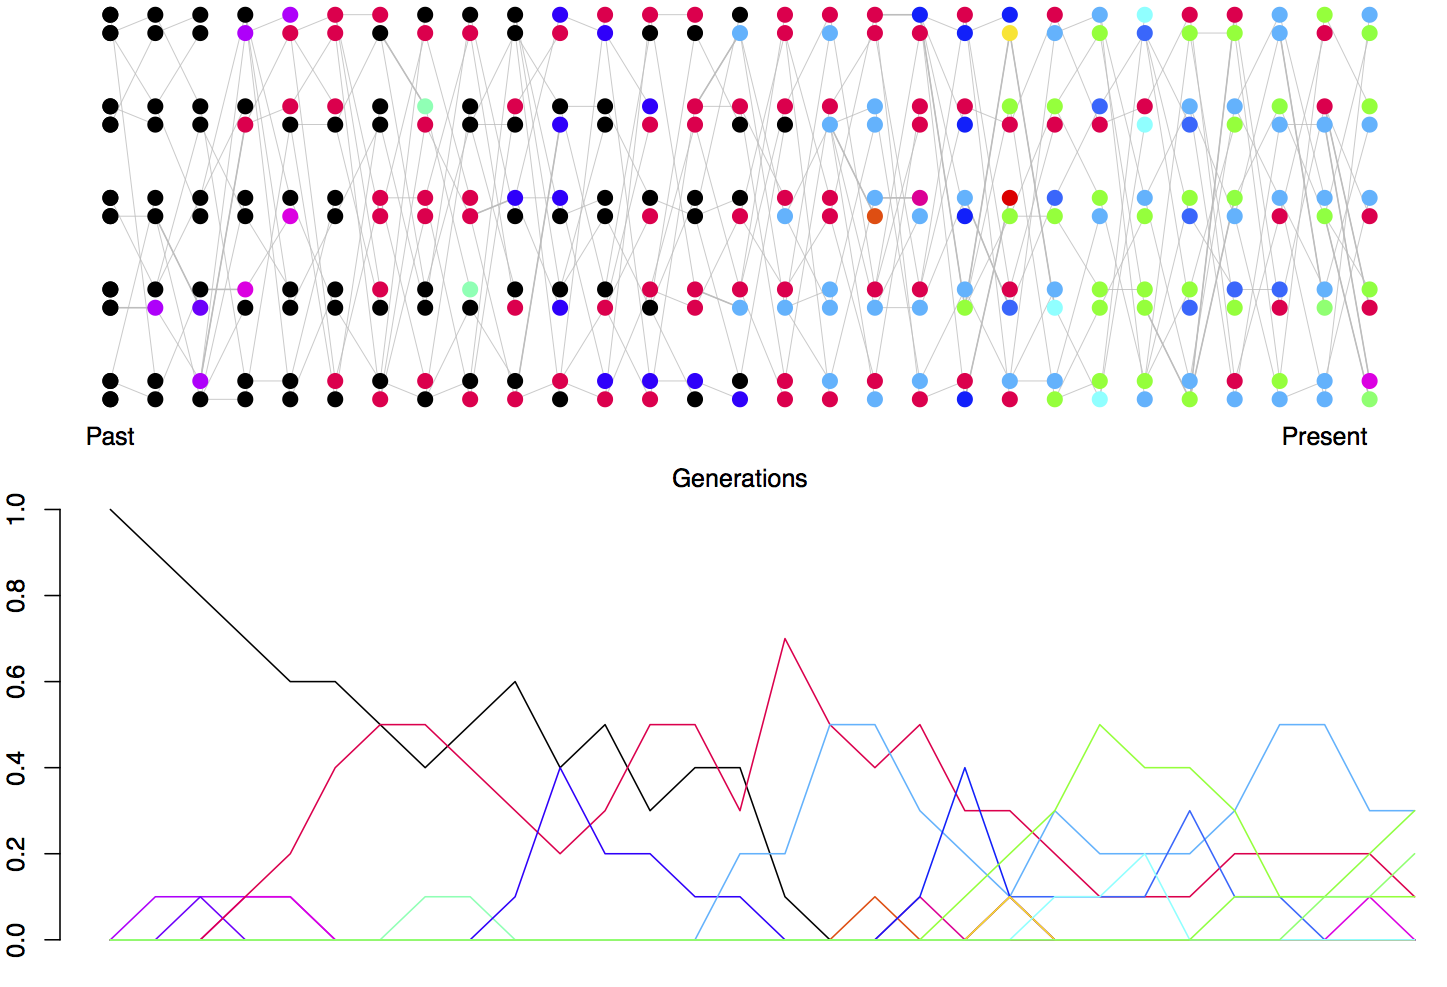
Mutation-drift equilibrium, mutations new colours are introduced in the transmission in 10% of transmissions (a unrealistically high mutation rate, but given the small population size it illustrates the point). Initially the population has only one type of allele but mutation is constantly introducing new alleles, which drift up and down in frequency, leading to an equilibrium level of diversity in the population
Loss_of_het_2_alleles

Mutation-Drift equilibrium tracking the frequency of alleles over time:
drift_freqs
Note that many newly mutated alleles drift into the population but are quickly lost.

A bunch more simulations of these types are in this pdf.

Trevor Bedford also has a nice set of simulation figures as well.

Posted in popgen teaching, teaching | 3 Comments

Lab trip to 23 & me

We took a trip down to visit 23 & me’s research group. Graham gave a talk on Alisa and Gideon’s work. Thanks to Kasia Bryc for the invitation.

23_and_me_pic
Vince, Graham, Gideon, Alisa, Kristin, Chenling and Ivan (Simon and Jeremy not pictured).

Posted in cooplab, photos, trips | Leave a comment